Designing User-Centred Reliability with Azure Monitor SLIs and the Azure SRE Agent
Most Kubernetes monitoring tells you that a pod restarted. It rarely tells you whether a customer noticed, which customers were affected, or whether the business promise is now at risk.
That gap is a product and service-design problem as much as a monitoring problem. The people responsible for a payment journey need to know whether checkout works, how quickly it works, and which customer segment is paying the cost of an incident. The on-call engineer needs enough evidence to choose the right first action. The business needs a trustworthy way to decide when an error budget has been spent.
I wanted to see whether an Azure Monitor SLI could give the Azure SRE Agent enough context to investigate an Azure Kubernetes Service failure, rather than just react to a pod alert. I built a small payment service, chose signals around the customer journey, and deliberately broke it.
The result is an infrastructure-as-code deployment that runs with azd up. It measures availability, latency, the full request journey, the public path, and customer tiers. Azure Monitor alerts on those service-level signals, and the Azure SRE Agent investigates the incident and, when allowed, fixes it.
The important result is not the number of Azure resources. It is the chain from customer need to operational decision:
| Question | Evidence | Decision it supports |
|---|---|---|
| Can customers complete checkout? | Journey availability | Treat the incident as a service problem, not a pod problem |
| Who is affected? | Customer-tier dimensions | Prioritise impact and communicate with the right customers |
| Is the public entry point working? | External availability | Avoid restarting healthy workloads when DNS or TLS is broken |
| Is the budget being spent quickly? | Burn rate | Decide whether to wake someone or continue observing |
| Is a remediation safe? | Logs, metrics, RBAC, and audit evidence | Automate only actions with a bounded risk |
I got several things wrong. The corrections stay in the post because they expose the difference between a design that looks plausible and one that has been tested with the people, decisions, and failure modes it is meant to serve.
Who this is for
This walkthrough is aimed at teams that share responsibility for a customer-facing service:
- Platform engineers who own Azure Monitor workspaces, identities, collection, and RBAC
- SRE and operations teams who define SLOs, error-budget policy, and incident response
- Product and engineering leaders who need reliability data expressed in terms of customer impact
- Teams evaluating how much operational work an AI agent should investigate, propose, or perform
Before getting into the build, three terms need separating. An SLI (Service Level Indicator) is the measured number, such as "99.2% of checkout requests succeeded in the last 24 hours." An SLO (Service Level Objective) is the internal target for that number, such as "availability stays above 99% over a rolling 28 days." An SLA (Service Level Agreement) is the contractual promise to a customer, and should be looser than the SLO.
Most teams have an SLA somewhere in a contract, an SLO nobody agreed on, and an SLI that's really just "whatever our dashboard happens to show."
Azure SRE Agent is Microsoft's AI agent product for exactly this problem: it watches Azure Monitor alerts, investigates using your actual logs and metrics, and, if configured to do so, takes a remediation action itself and looks for root cause if it has access to the codebase. No human has to be paged, triage the graphs, and type kubectl scale at 3am. The agent does the first pass, and depending on how much you trust it for a given incident class, either proposes what it would do or does it.
The outcome I wanted was an SLO breach that names which customer segment is affected, a differentiated service commitment expressed in Azure Monitor, and an AI agent that checks the other firing SLIs before it touches a workload.
Start with the service promise
The arrow from slis to alerts is the design decision I cared about. The alerts read the SLI's own published metrics, not a second implementation built from raw application counters. That keeps the alert and the SLO measuring the same customer promise.
This is the first design-thinking checkpoint: define the outcome before choosing the tool. “A pod is ready” is an implementation fact. “A customer can complete checkout within 500 milliseconds” is an outcome. Both are useful, but they answer different questions and should not be treated as interchangeable.
The repository, including the Bicep, fault-injection scripts, and agent configuration, is public: lukemurraynz/AzureSLI-AzureSREAgent.
Give the service a durable identity
An SLI in Azure Monitor is an extension resource on a tenant-scoped Service Group:
/providers/Microsoft.Management/serviceGroups/<sg>/providers/Microsoft.Monitor/slis/<name>
That scope is the point. A service is rarely one resource group: frontend here, API there, and a database in a shared subscription. A tenant-scoped Service Group gives the service an identity that outlives any particular resource layout, so the SLO follows the customer experience rather than a cluster.
For a platform team, this reduces the cost of change. Teams can move workloads, split deployments, or replace a dependency without making the reliability conversation start again. For a product team, it creates a stable place to discuss whether the service is meeting its promise.
There is an important boundary here: a Service Group is an operational view, not a security boundary. It is currently in public preview, and membership does not grant access to the resources inside it. A resource can belong to multiple Service Groups, which is useful when platform, product, and customer-support teams need different views of the same service. Keep resource RBAC and Service Group RBAC as separate design decisions.
The Service Group does not define what the SLI measures. There is no membership involved. An SLI's scope is sourceAmwAccountResourceId (Azure Monitor Workspace) plus a metric name and dimension filters:
"filters": [
  { "dimensionName": "namespace",   "operator": "eq",            "value": "payment" },
  { "dimensionName": "service",     "operator": "eq",            "value": "frontend" },
  { "dimensionName": "path",        "operator": "eq",            "value": "/checkout" },
  { "dimensionName": "status_code", "operator": "notstartswith", "value": "5" }
]
The Service Group is the SLO's home, not its definition. Membership gives you topology and rollup, but changes nothing about what any SLI computes.
Plan the SLI identity path
The SLI also has an identity and data-storage path that is easy to miss when the portal hides the plumbing. Azure Monitor reads the source Azure Monitor Workspace and writes the evaluated SLI results to a destination workspace. A user-assigned managed identity needs Monitoring Reader on the source workspace, Monitoring Reader plus Monitoring Metrics Publisher on the destination workspace, and Monitoring Reader on the destination workspace's default data collection rule. The source and destination can be the same workspace, but separating raw telemetry from evaluated reliability data can make ownership and access easier to explain.
This is a useful handoff between platform and product teams. The product team defines what “good” means. The platform team owns the identity, workspace boundaries, collection rules, and retention that make that definition executable.
Membership is ordinary Bicep, with one sharp edge. 2026-03-01-preview returned RelLifecycleNotEnabledForTenant; the older 2023-09-01-preview worked:
targetScope = 'subscription'

resource serviceGroupMembership 'Microsoft.Relationships/serviceGroupMember@2023-09-01-preview' = {
  name: 'slisreShowcaseBicep' // alphanumeric only, 3-64 chars
  properties: {
    targetId: '/providers/Microsoft.Management/serviceGroups/${serviceGroupId}'
  }
}
The relationship's parent is the member, not the Service Group, so this is subscription-scoped. The SLIs are the opposite case: their parent is the Service Group, which forces a tenant-scoped deployment and an Azure RBAC grant at / that Global Administrator does not confer.
You can express "one SLO across frontend, API and auth" today with one multi-value filter:
{
  "dimensionName": "service",
  "operator": "in",
  "value": "frontend^^api^^upstream-auth-service",
}
in and notin take a ^^-delimited string, not a JSON array. That's documented in one TypeSpec comment and nowhere else.
Turn customer needs into measurable questions
Each SLI exists because the basic availability number leaves a different customer or business question unanswered. A sixth, latency-windowed, measures the same 500ms bar as mean latency per five-minute window rather than per request, and is covered separately below.
Azure Monitor offers two evaluation methods. Request-based evaluation asks whether the ratio of good requests to total requests meets the target. Window-based evaluation asks whether time intervals meet a quality threshold. Request-based evaluation is usually the better fit for checkout because one failed transaction should count as a failed transaction, even during a quiet period. Window-based evaluation can be useful when you want to smooth short bursts or measure the proportion of time a system remains within a limit. Choose the method with the customer experience and decision in mind, not the metric that happens to be easiest to query.
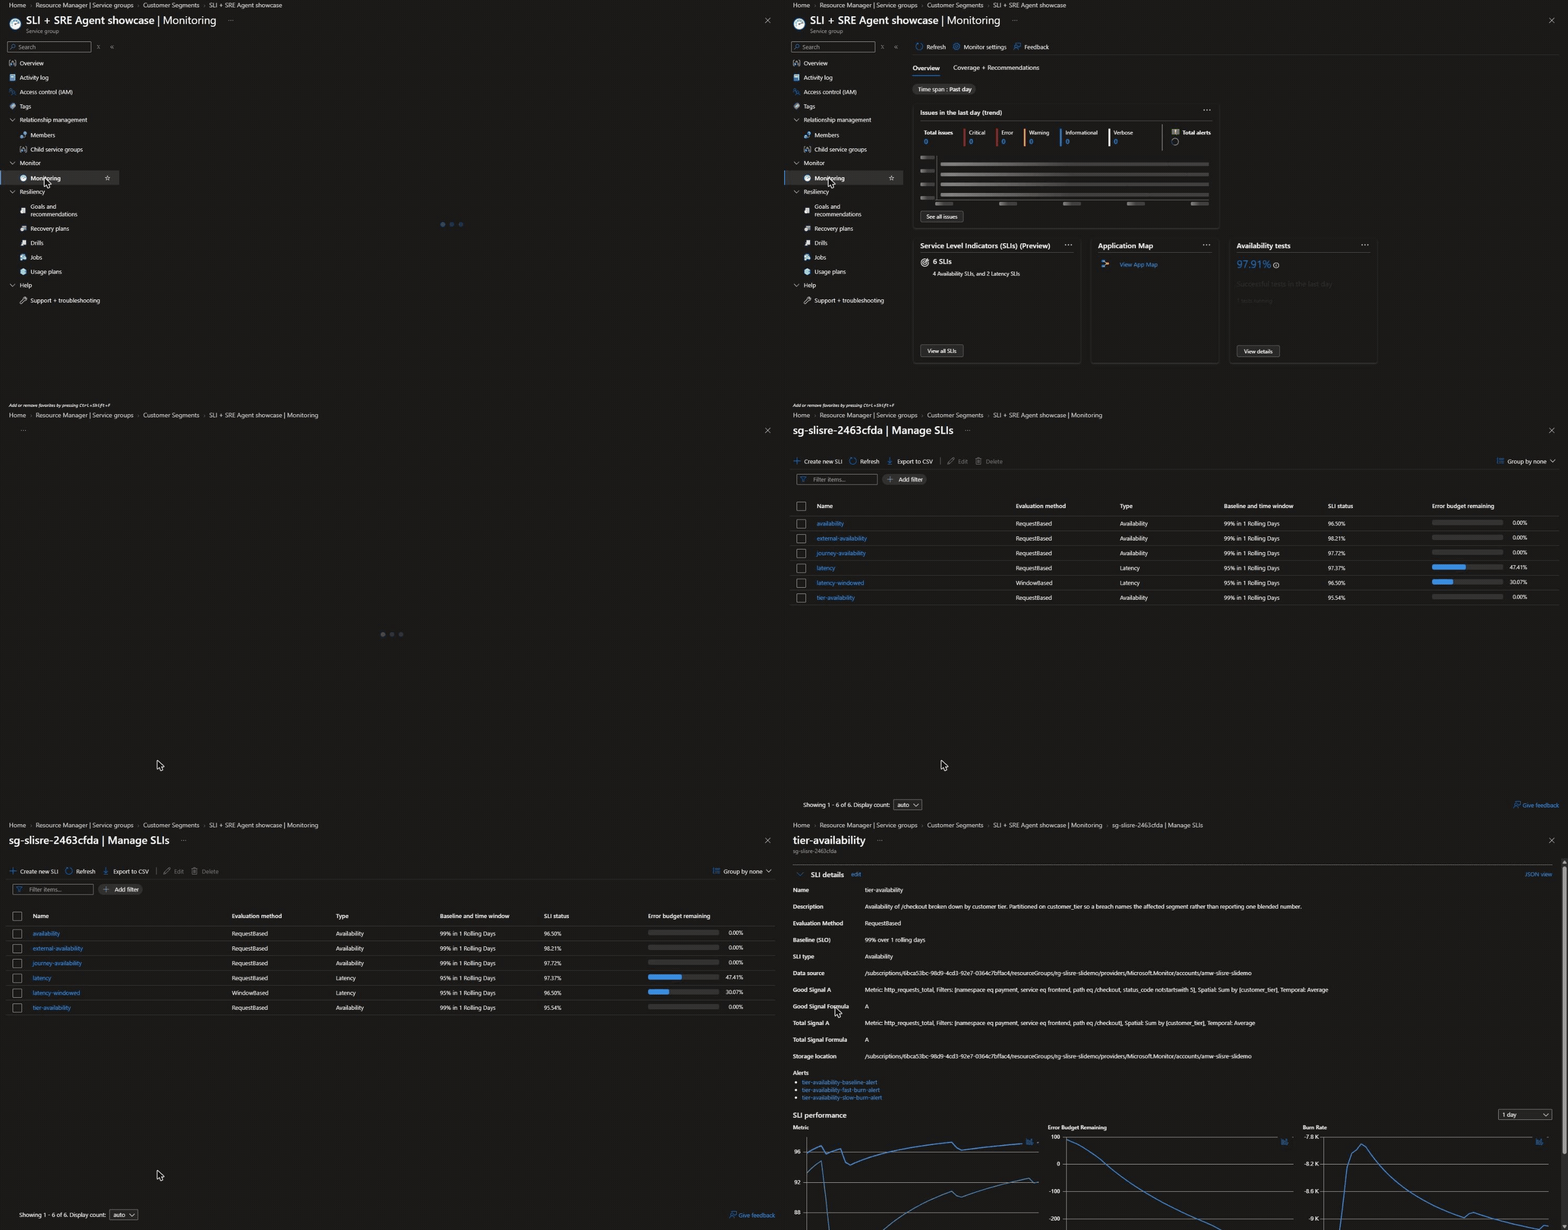
| SLI | User or business question |
|---|---|
availability | Is the checkout edge returning successful responses? |
journey-availability | Does the complete request journey work across the frontend, API, and auth service? |
latency | Can customers complete the action quickly enough to trust the service? |
external-availability | Can a user outside the cluster reach the public service? |
tier-availability | Is the impact concentrated in a customer segment? |
availability measures the edge at /checkout: good requests over total. journey-availability spans all three tiers with the in filter. An edge-only SLI stays green when the API fails and the frontend serves a cached fallback, while the user's journey is broken.
latency exists because a service that answers every request in nine seconds is up, and useless. Good is the le="0.5" histogram bucket; total is the request count.
external-availability matters because every SLI above is computed from traffic generated inside the cluster. You cannot measure an outage from inside the thing that is unreachable. If DNS breaks or the load balancer misroutes, no request arrives, so there is no error metric and no denominator either. Availability reads 100% during a total outage. That is structural; it needs something outside the workload requesting the service over the real network path.
tier-availability is the same measurement as availability, partitioned by who the customer is rather than by which component served them.
For any SLO, ask which signal moves if DNS breaks. If none does, it measures instrumentation rather than availability. Then ask who needs to act on the signal and what decision it should change. That turns a dashboard metric into a useful service conversation.
Choose signals that represent people, not components
The demo app is instrumented with the Prometheus client because I wrote it. Most workloads you need SLOs for are not yours to change, and that's fine: the SLI reads Prometheus series from an Azure Monitor Workspace and does not care what produced them.
| Source | App change | Gives you |
|---|---|---|
| Ingress controller metrics | None | nginx_ingress_controller_requests{service,status} |
| Service mesh sidecar | None | Per-hop RED metrics |
blackbox_exporter | None | probe_success and certificate-expiry alerting |
| OTel auto-instrumentation | None (agent) | In-process HTTP metrics |
| App instrumentation | Yes | Whatever you choose |
Prefer an infrastructure-emitted signal even when you can instrument the app. It survives redeploys, language changes and vendor upgrades, and is uniform across every service behind it.
One trap cost me hours: for Managed Prometheus sources, metricNamespace must be customdefault, not prometheus. With the wrong value the metric resolves fine and SLI creation fails with errors about dimensions, which is entirely the wrong place to look.
Measuring users, not components
An SLI's scope is a dimension filter, not a resource. journey-availability spans three Kubernetes Deployments purely because of:
{
  "dimensionName": "service",
  "operator": "in",
  "value": "frontend^^api^^upstream-auth-service"
}
Add a fourth tier tomorrow and it joins the SLO by emitting the label. Nothing gets registered. The SLO describes the journey; the deployment topology is free to change underneath it.
| Filter on | The SLO says |
|---|---|
pod, container, node | "a component is unhealthy" |
service, namespace | "a system is degraded" |
path, journey | "an action users take is failing" |
customer_tier, tenant, region | "these users are affected" |
The partition trick
The dimensions do not have to be technical. This app emits customer_tier from a request header and propagates it across every hop:
KNOWN_TIERS = frozenset({"premium", "standard", "free"})
DEFAULT_TIER = "standard"

tier = request.headers.get("x-customer-tier", DEFAULT_TIER).lower()
if tier not in KNOWN_TIERS:      # never let a caller mint unbounded series
    tier = DEFAULT_TIER
The SLI partitions on it via spatialAggregation.dimensions:
"spatialAggregation": { "type": "Sum", "dimensions": ["customer_tier"] }
The alert uses the portal's own idiom:
sum without ("INCLUDE-ALL-DIMENSIONS-DONT-REMOVE") ({__name__="...:good"})
Summing without a label that does not exist aggregates while preserving every real dimension, so one alert rule fires once per partition. One SLI, one rule, and the incident names the affected segment.
Break premium only:
./scripts/inject-fault.sh --mode=errors --rate=100 --tier=premium
| At the same instant | Reports |
|---|---|
availability | 85.02%. Service degraded. Cause unknown. |
tier-availability | premium 0.00%, standard 100.00%, free 100.00% |
The second has already eliminated most of the search space: not a capacity problem, not a dependency outage, and not a deployment affecting everyone. Something is routing premium differently. That is a fault class per-service telemetry cannot see at all: every pod is healthy, every tier is up, and only the signal partitioned by who the user is moves.
This is where the business lens changes the response. A blended 85.02% can trigger concern, but it does not tell a product manager whether premium customers, free customers, or everyone is affected. The partitioned result supports prioritisation, customer communication, and a more honest conversation about differentiated service commitments.
Imagine a premium customer trying to complete checkout during this fault. The pods are healthy and the overall availability number is still above zero, but that customer cannot complete the transaction. The tier-specific SLI turns that experience into an operational fact: investigate the premium path first, communicate the impact accurately, and avoid spending the incident response effort on healthy free and standard traffic.
There are four limits:
- Azure cannot infer business dimensions.
customer_tierexists because the application chose to emit it. - Cardinality is the tax. Keep business dimensions closed and small; tenant IDs are usually a bill, not a feature.
- Targets are per SLI, not per partition. Differentiated targets need one SLI per tier.
- In-cluster signals stay blind to the front door. Partitioning does not fix what
external-availabilityexists to fix.
The Service Group gives the service a tenant-scoped identity that survives resource churn. Through customProperties.sliId, the agent gets a service-level fact about users rather than a symptom about pods.
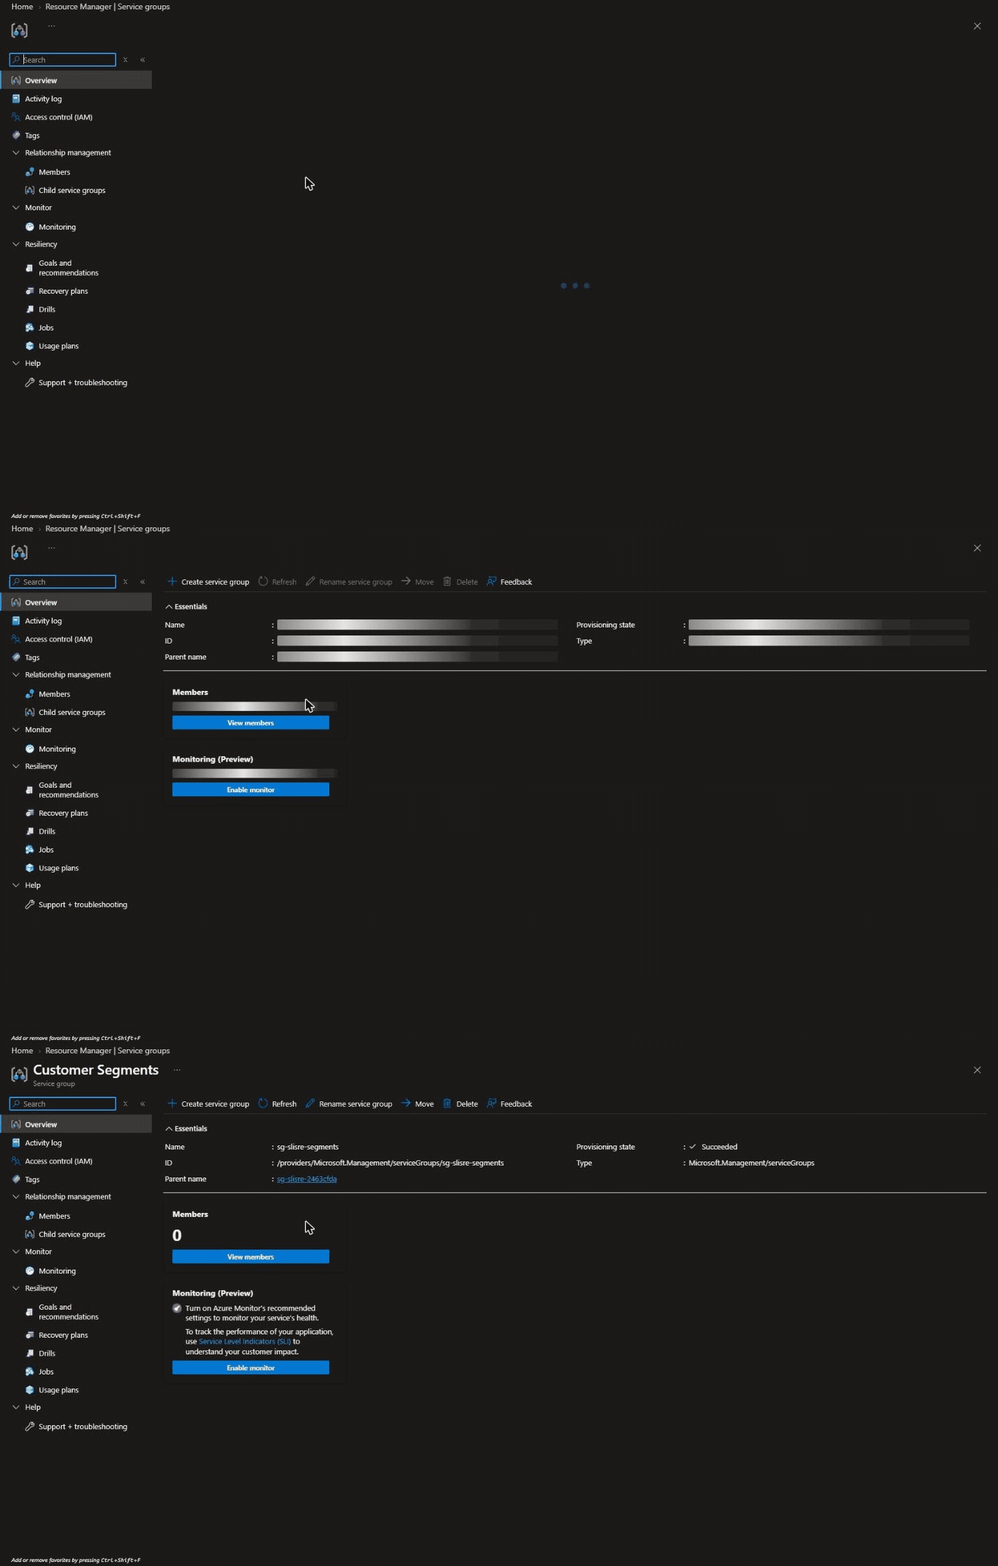
Service Groups nest too. A child group joins a parent via properties.parent.resourceId at create time. The differentiated-target SLIs now live in a Customer Segments child group under the parent, without moving the existing six SLIs or their history.
Make the alert answer a business question
Azure Monitor has a native SLI alerting path. In the portal, enableAlert can configure a baseline alert, fast-burn alert, and slow-burn alert, with an action group defining who is notified and what downstream action runs. That is the shortest path when you want the platform's standard SLI experience.
I used a second path in this project: explicit Microsoft.Insights/metricAlerts resources using Microsoft.Azure.Monitor.PromQLCriteria, scoped to the Azure Monitor Workspace. That gave me infrastructure-as-code control over the PromQL, dimensions, custom properties, and alert names used by the SRE Agent. It is not a replacement for native SLI alerting. Decide which path owns the policy, and avoid enabling both for the same condition unless duplicate notifications are intentional.
They read the SLI's own published metrics, <sli>:Good, <sli>:Total, and <sli>:Value:
(
  ( sum(increase({__name__="ns::<sg>/m::availability:total"}[15m]))
  - sum(increase({__name__="ns::<sg>/m::availability:good"}[15m])) )
  /
  ( sum(increase({__name__="ns::<sg>/m::availability:total"}[15m])) * (1 - 0.99) )
) > 14
I originally recomputed the same signal in parallel Prometheus rules. Those selectors summed across all three tiers and left /healthz in the denominator, making the alert materially less sensitive than the SLO. Both objects looked correct in isolation, and total-outage testing did not catch it. Detection latency was 9m47s versus 5m20s on the same outage.
Alerts derived from the SLI's own output cannot drift from it. That safety property is the technical argument. The business argument is that the alert represents the same commitment people agreed to measure, rather than an engineer's approximation of it.

Use error budgets to guide attention
Burn rate is how fast you're spending error budget. At a 99% target, a 2% error rate burns at 2x; a 20% error rate burns at 20x. That makes an error budget a decision tool: it connects reliability work to the limited amount of failure the service can afford before customers and the business feel the impact.
The canonical 14x over one hour and 6x over six hours assumes a 30-day budget. On a one-day window with a 0.5% budget, the long window becomes the rate limiter:
| Injected error rate | Time for the 1h window to trip |
|---|---|
| 95% (total outage) | ~4.5 min |
| 20% | ~22 min |
| 8% | ~54 min |
Derive the long window from the compliance window. Shortening it to 15 minutes took a 20% error rate from roughly 22 minutes to a measured 8m36s end to end.
A correction: sum_over_time() was wrong here
The SLI's :good and :total are cumulative across the compliance window, not counters. sum_over_time(...[15m]) therefore sums fifteen cumulative snapshots. It is accumulated damage, not the error rate during those fifteen minutes.
The practical consequence was a complete backend outage that ran for twelve minutes without crossing the 14x threshold. Treat the baseline attainment alert as the fast detector; keep burn-rate alerts for the budget-spend signal. If true short-window sensitivity is required, compute it from raw application counters with rate(), accepting the drift risk this design otherwise avoids.
A second correction: rate() was not the problem
That conclusion was half wrong. sum_over_time()/rate() returning empty was true of exactly one test: a brand-new SLI queried within its first evaluation cycles. rate() and increase() need at least two samples spanning the lookback window. After a day of samples, rate(), increase() and delta() all returned normal values.
On identical 15-minute fault injections, sum_over_time() took 49 minutes to trip; increase() took 10m06s, most of which was the mandatory five-minute sustained-condition window. Use increase(), not sum_over_time(), and interpret an empty PromQL result as "not enough history yet" until proven otherwise.
Design the handoff from signal to action
The agent subscribes to Azure Monitor directly through incidentManagementConfiguration.type: AzMonitor, scoped by knowledgeGraphConfiguration.managedResources to the resource group. It is not wired through an action group. That is a different integration path from native SLI alert notifications: the SRE Agent receives the Azure Monitor incident, while an action group can notify people or invoke other automation.

Each alert carries structural context:
{
  "sliId": "/providers/.../serviceGroups/<sg>/providers/Microsoft.Monitor/slis/availability",
  "serviceGroupId": "/providers/Microsoft.Management/serviceGroups/<sg>",
  "alertKind": "fast-burn-rate",
  "burnRate": "14",
  "lookback": "15m",
}
The agent can resolve sliId and learn the target, compliance window, and filters. The incident opens as “the /checkout journey at the frontend edge, committed at 99% over a one-day rolling window, is at 93.4%,” not “a burn-rate rule exceeded 6”. The first version gives an operator or an agent a user-centred problem to investigate.
The handoff also follows a useful service-design pattern: preserve context as the problem moves between people and systems. The alert carries the service, journey, target, customer segment, and time window. The agent can then investigate the likely experience before choosing an implementation-level action.
Correlation is the fastest diagnosis
availability | external-availability | Cause | First action |
|---|---|---|---|
| Firing | Firing | Real workload failure | Investigate pods and events |
| Healthy | Firing | DNS, load balancer, TLS | Do not restart pods |
| Firing | Healthy | Path the probe does not exercise | Compare with journey-availability |
| Healthy | Healthy | Suspect the telemetry | Check meta-monitoring |
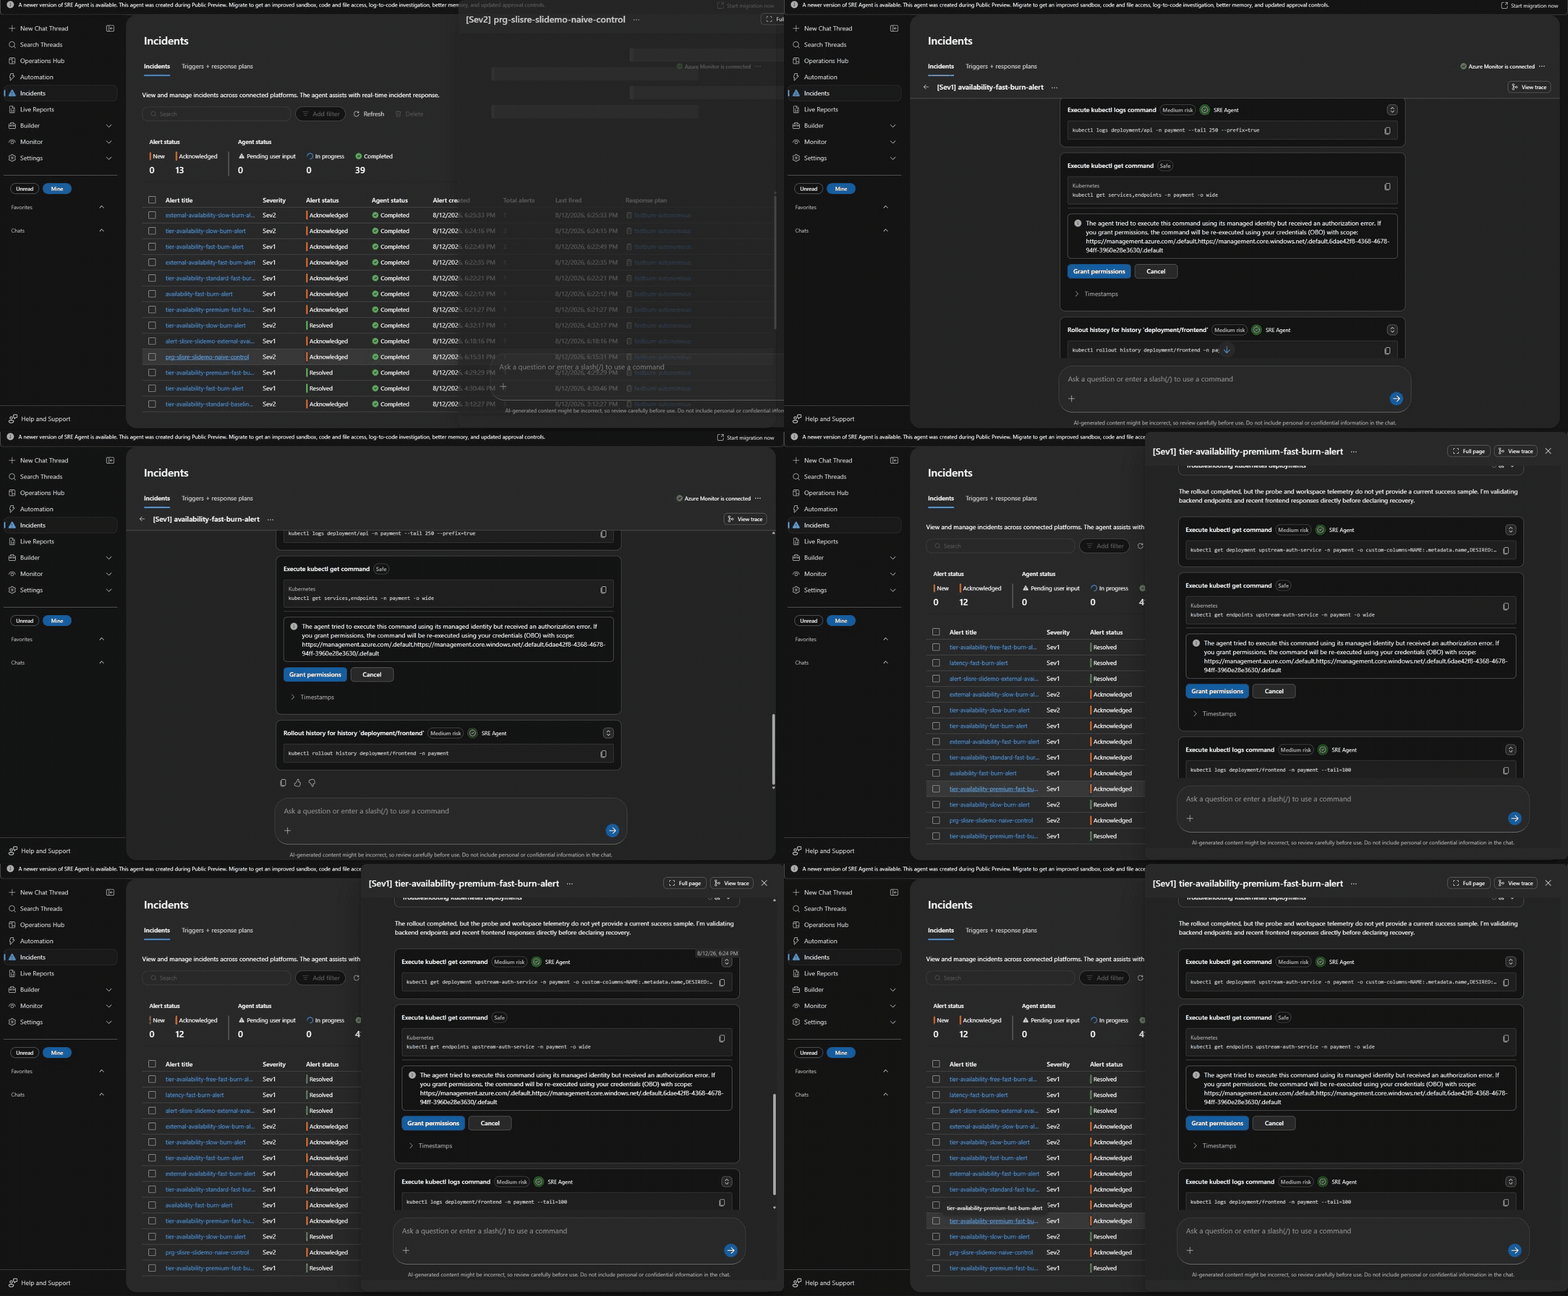
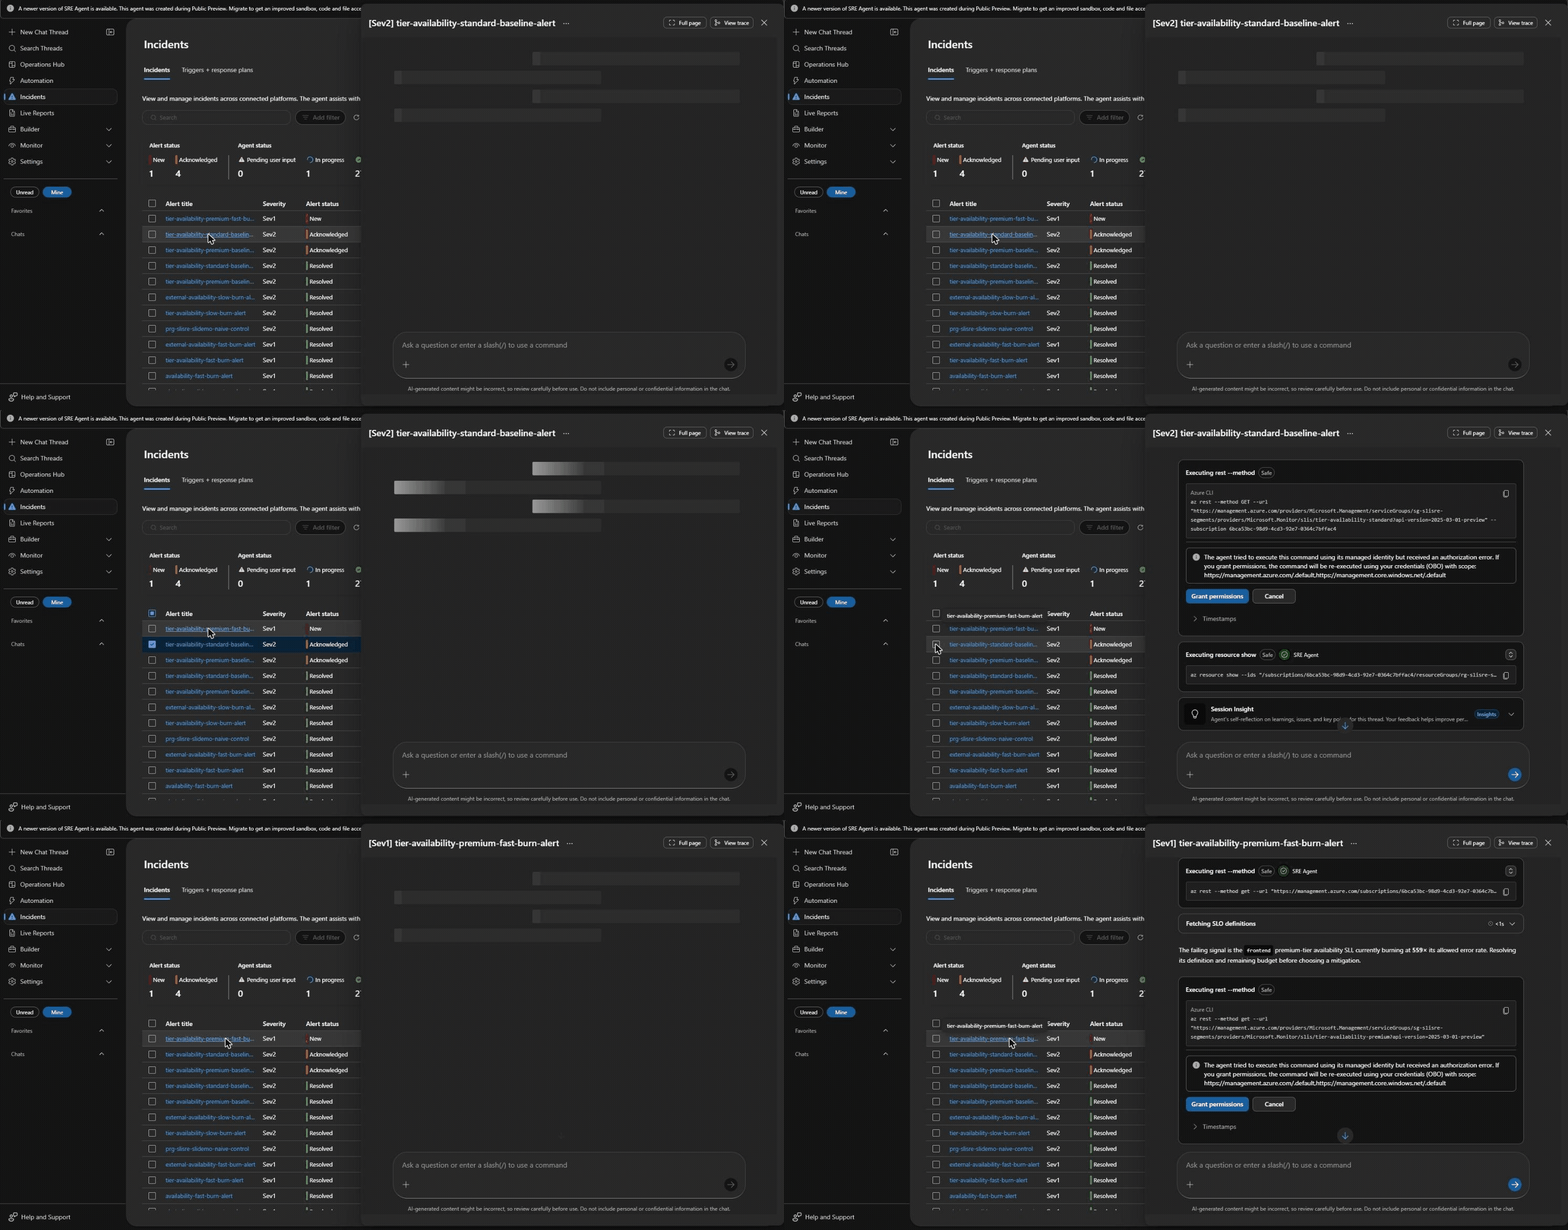
Given a Deployment scaled to zero, the agent ran 31+ tool calls, queried Log Analytics, correctly root-caused the missing pods, and scaled the Deployment back up. Injection to recovery was about 20 minutes, roughly five of them detection.
The current SRE Agent guidance recommends starting with Reader access, where writes require approval, and moving to Privileged access only after the team trusts the workflow. That is a good pilot model: begin with investigation and proposed remediation, measure false positives and recovery quality, then grant the smallest write permission for a narrow incident class. The agent also creates or uses Application Insights and persists investigation context, so data retention, cost, region, and who can review that operational memory belong in the service design as well. The SRE Agent security overview describes the related identity, isolation, and telemetry considerations.
On a later run it refused to declare success based only on rollout status: "the rollout completed, but the probe and workspace telemetry do not yet provide a current success sample." kubectl confirmed the outcome it was checking for: 2/2 ready.
Treat trust as part of the service design
The agent needs Kubernetes access to act, but permission to act is not the same as evidence that it should act. Scope the permissions tightly:
| Role | Scope |
|---|---|
| Azure Kubernetes Service Cluster User | Cluster; fetches a kubeconfig, grants nothing on its own |
| Azure Kubernetes Service RBAC Writer | One namespace |
Writer rather than Admin excludes role bindings, so the agent cannot grant itself anything further.
PreToolUse hooks gate individual actions, but only if their matchers bind. Mine shipped with ^(restart_|scale_).*, copied from another framework. The real tool names are PascalCase: RunKubectlWriteCommand, Terminal, and RunInTerminal. The hooks matched zero tools while reporting HooksRun: 2, FinalDecision: pass.
When the agent remediated, it used RunInTerminal, not the obvious kubectl-specific tool. A matcher listing only write tools would have missed it.
A response plan with agentMode: review also did not prevent execution in my test. That contradicted the current product guidance, which describes Review mode as requiring approval for write operations, so I treated it as a behaviour to retest rather than a safety guarantee.
From a design-thinking perspective, the question is not “can the AI fix the incident?” It is “what level of autonomy is appropriate for this incident, this customer impact, and this reversibility?” A scale-up in one namespace may be a bounded experiment. A database migration or a change affecting every tenant is a different service risk and needs a different approval model.
The re-test showed why the underlying control matters
I wrote that Review was the one control that prevented writes after testing it once. It was not. Repeating the scaled-to-zero fault twice showed the supervised agent, ARM mode: Review, performing the scale operation without approval.
The agent's incident telemetry said IncidentMitigatedByAgent: False both times. Kubernetes audit logs were the only reliable witness: kube-audit-admin named the principal that executed the PATCH .../scale request. Treat that discrepancy as release-specific behaviour to verify in your tenant, not as a supported guarantee either way.
The cause was a hook named require-approval-for-restarts whose content effectively said: deny unless the action is confined to the namespace, reversible, evidence-backed, and not a delete. It did not check whether a human had approved anything. The agent was grading its own homework.
I rewrote the hook to unconditionally deny and re-tested with a fresh fault injection. The autonomous agent performed the fix; the supervised agent investigated and touched nothing. One clean run is evidence, not a guarantee, so keep testing the layer underneath the telemetry.

Test the experience, not only the configuration
- An enabled monitoring addon does not enable collection.
omsAgent.enableddeploys the agent; a data collection rule makes it collect. Without the DCR, Container Insights is empty and nothing reports an error. Managed Prometheus has the same DCE/DCR/DCRA trap. - Absent data makes burn-rate alerts stop firing. A zero denominator produces
NaN, andNaN > thresholdis false. Alert explicitly on absence withabsent(). - Incident titles reach the agent URL-encoded.
availability baseline alertbecomesavailability%20baseline%20alert, so a plan matching spaces never matches. Name alerts without spaces. - Overlapping response plans disable the agent. Several matching plans created incidents that were marked handled within a minute while running zero tools. One matching plan produced 31 tool calls and a successful remediation.
A query returning zero rows and a query that can never work are indistinguishable. Establish a positive control before believing an empty result. More broadly, test the experience you intend to protect: inject a fault, observe the customer-facing signal, check the alert context, and verify the action or refusal in the underlying audit trail.

Make reliability legible to decision-makers
The platform engineer wanted a single pane connecting infrastructure state to user reliability. For most of this project that was two panes: pod health in Log Analytics with KQL, and SLI evaluations in the Azure Monitor Workspace with PromQL.
Workbooks support Prometheus as a data source. The JSON shape is undocumented, but the portal's own workbook uses this form:
{
  "queryType": 16,
  "resourceType": "microsoft.monitor/accounts",
  "crossComponentResources": ["<azure monitor workspace resource id>"],
  "query": "{\"version\":\"PrometheusQueryProvider/1.0\",\"queryText\":\"slo:error_budget:remaining_ratio\",\"type\":\"query_range\"}",
}
The composite panel uses the minimum attainment across every SLI rather than an average. A premium-tier outage should read “we are breaching our worst commitment”, not disappear inside a blended number.
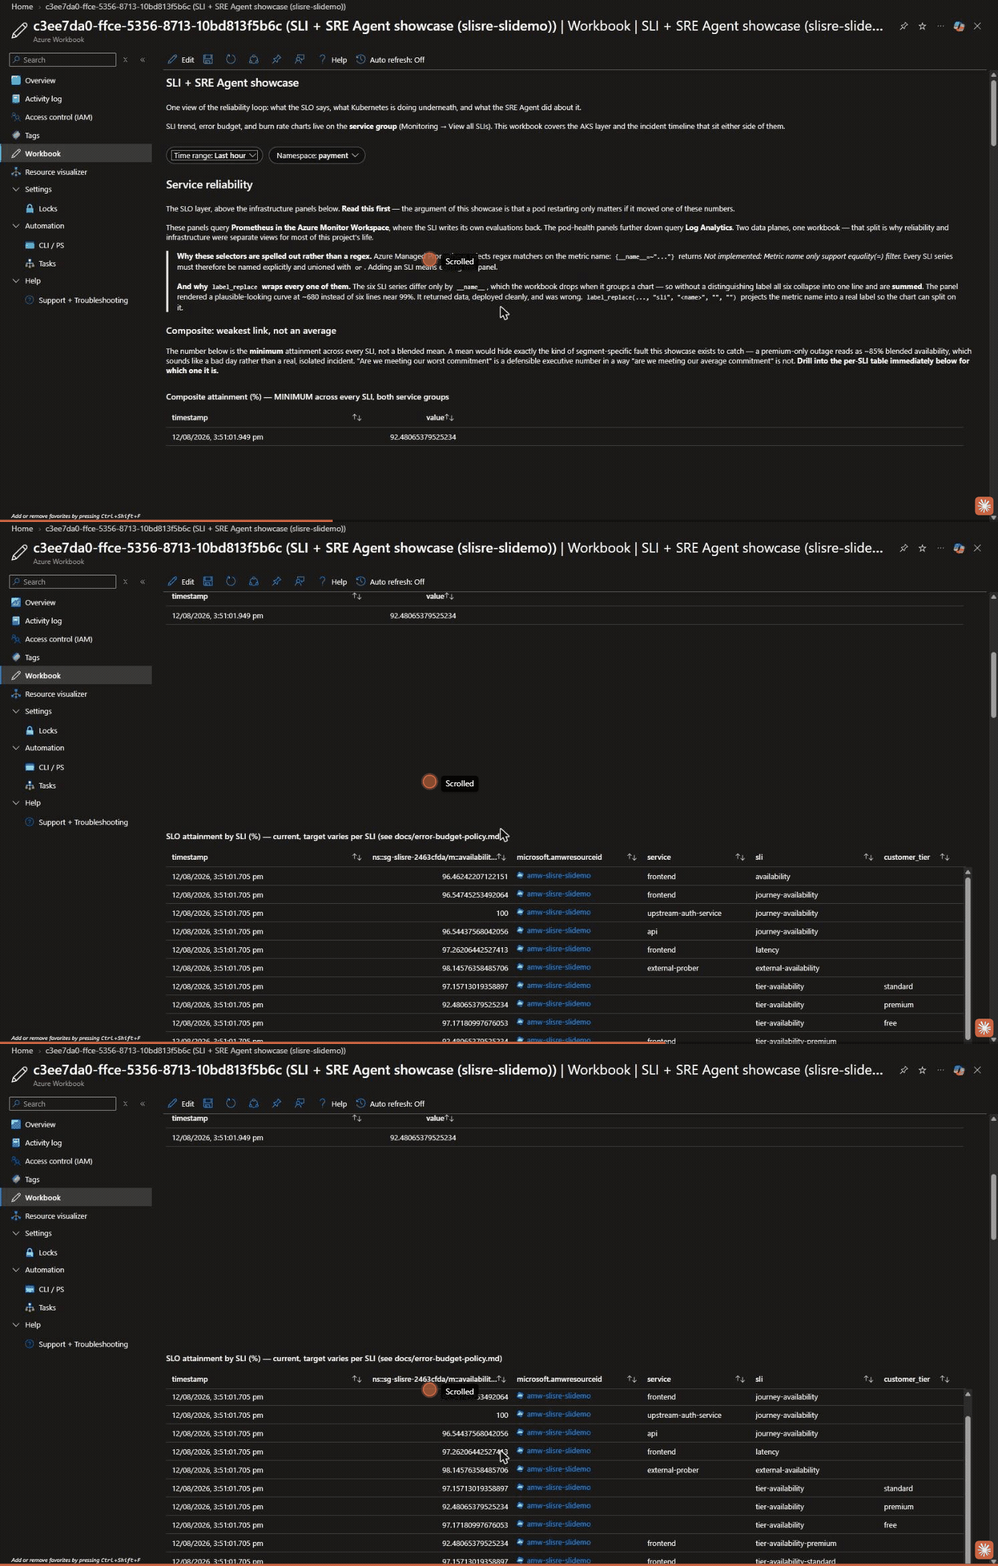
That panel also closes the reporting gap for the engineering manager, who needs credible error-budget reporting but is least likely to browse nine SLI charts. Alerting on a number is not the same as being able to see its trend, and a trend without an agreed decision is not a useful outcome either.
What it still does not do
- Service Groups are still in public preview. Do not make a production security or compliance boundary depend on Service Group membership, and confirm the current preview terms before adopting the pattern broadly.
- An SLI's definition is portable, but its execution is not permission-free. The managed identity, source and destination workspaces, default data collection rule, and metric collection path all need to be healthy.
- The in-cluster SLIs still measure in-cluster traffic.
external-availabilitycovers the public path; the rest are blind to ingress and DNS by construction. - The tier SLA table is a draft, not a signed contract. Differentiated targets exist and alert independently, but nothing enforces the SLA outside that policy document.
- The one-day compliance window is a demo choice so the budget visibly moves. Never copy
evaluationPeriodDays: 1into production without an explicit decision. - Native SLI alerts and explicit PromQL metric alerts are two policy paths. Choose one owner for each condition, or document why duplicate alert routes are useful.
- SLOs do not detect outages faster than a probe. On the same outage, the external web test fired in 3m37s and the burn-rate alert in roughly five minutes. SLOs earn their place in the ambiguous middle: deciding whether a 2% error rate is worth waking someone for.
A reliability design checklist
Start with the user's task and the business promise. Measure the user, not the application. Ask what moves if DNS breaks. If none of the signals move, you have instrumentation, not an SLO.
Choose dimensions that support a decision. Customer tier, journey, region, and tenant can explain impact, but uncontrolled cardinality can make the signal expensive and noisy.
Derive alerts from the SLI, never alongside it. A parallel implementation will drift silently toward being less sensitive than the SLO it enforces, and it will pass testing because total outages trip almost anything.
Design the handoff for the person or agent who must act. Carry the service identity, customer impact, target, and evidence into the incident instead of exposing only a rule name.
Verify guardrails by trying to breach them. Hooks that match nothing, plan modes that do not supervise, and rules that never evaluate all look identical to ones that work. The difference is visible only when you inject a fault and watch what happens.
Finally, treat reliability as a learning loop. Observe the customer experience, interpret the evidence with the people who own the outcome, test the smallest safe intervention, and update the design when reality disagrees with the model.
The repository, including the Bicep, fault-injection scripts, and agent configuration, is public: lukemurraynz/AzureSLI-AzureSREAgent.