Configure Azure Virtual Desktop Monitoring Insights
Microsoft has now added a built-in Monitoring workbook for Azure Virtual Desktop performance monitoring; this monitoring includes dashboards related (but not limited to):
- Session host diagnostics
- Connection performance
- Host performance
- User login events
- Remote Desktop client versions
To configure, we first need to create a Log Analytics workspace that both the Host Pool and Workspace will connect to.
Create a Log Analytics workspace
You can use a Log Analytics workspace if it already exists; if not, we will have to create one.
- Log in to the Azure Portal
- Click on + Create a Resource
- Search for: Log Analytics workspace
- Click Create

- Here we can select the Resource Group, Name and Location of the Log Analytics workspace we will create.
- I am going to create a new Resource Group called: aad_mgmt
- I click Create New and enter in the name of the Resource Group
- Under Instance Details, make sure you select a name that adheres to your naming governance.
- Note: the name of your Log Analytics workspace is now scoped to the Resource Group, so you can have Log Analytics workspaces with the same name, as long as they are indifferent resource groups.

- Click on: Next: Pricing Tier
- Select the applicable pricing tier, I only have Pay-as-you-go (Per GB 2018), so I will select that.
- Note: You can view the Pricing for Log Analytics on the Pricing Calculator: look at the Pay-As-You rates.

- Click Next: Tags
- Enter in any applicable tags, such as Creator, Who it may get billed to, Project ID etc. that’s relevant and select Review + Create
- Review the configuration and click Create to create your Log Analytics workspace! (It should take less than a minute.)
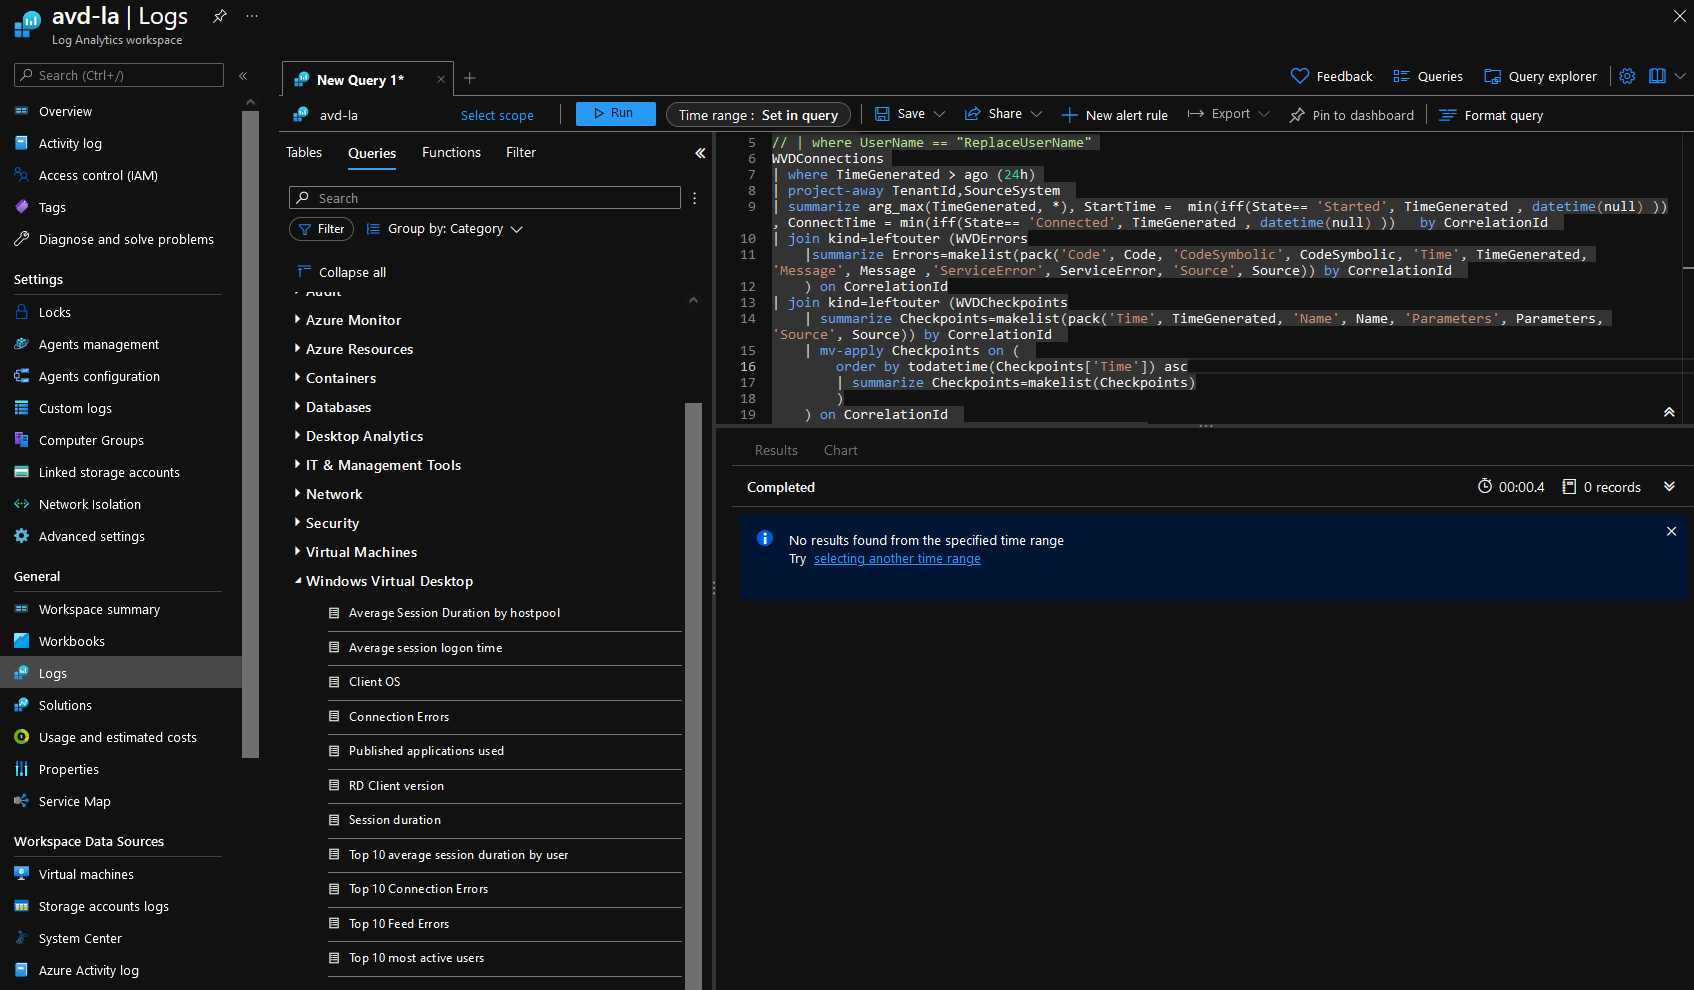
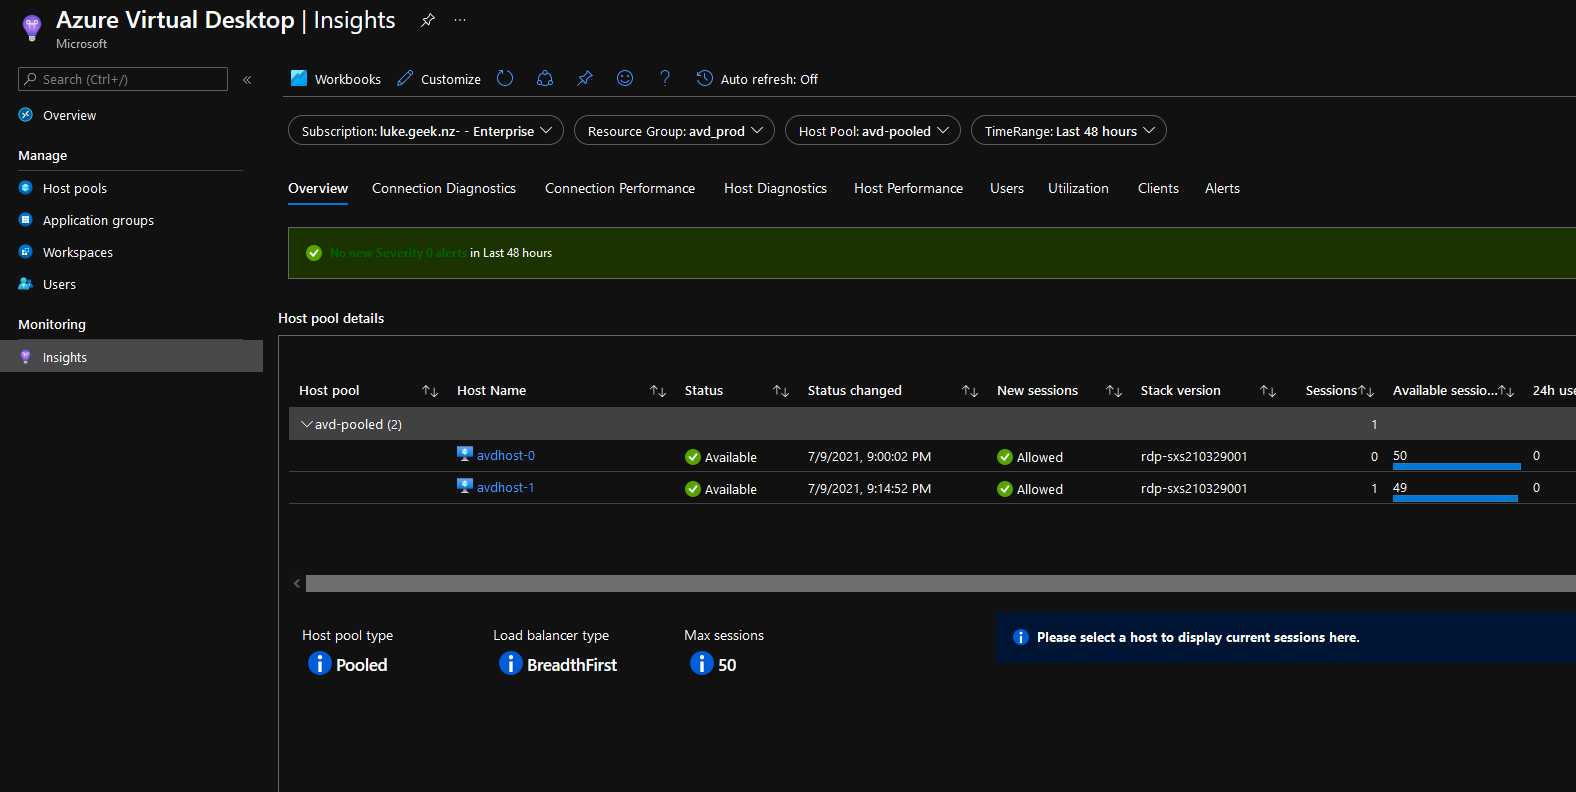
Configure Azure Virtual Desktop Insights
-
Log in to the Azure Portal
-
Search for: Azure Virtual Desktop
-
Click on Insights
-
A Workbook blade should now greet you
-
This is where we will configure the Azure Virtual Desktop Insights. You can see on the lower right-hand side that we will be deploying Azure Monitor for 'Windows Virtual Desktop v1.0.4' (however, this will be managed by Microsoft, but it is handy to know the version in case of support later on).
-

-
Click on Open Configuration Workbook
-
Here, select the Log Analytics workspace you created earlier (or want to use)
-
Select Configure host pool
-

-
Click on Deploy (make sure all your Session Hosta are started so that Azure can deploy and configure the Log Analytics agent on the Virtual Machines)
-
You can select View Template and Parameters if you want to confirm the host pool and workspace configured.
-

-
While the Diagnostic host pool settings are being configured, click on Configure workspace.
-
Click on: Deploy
-
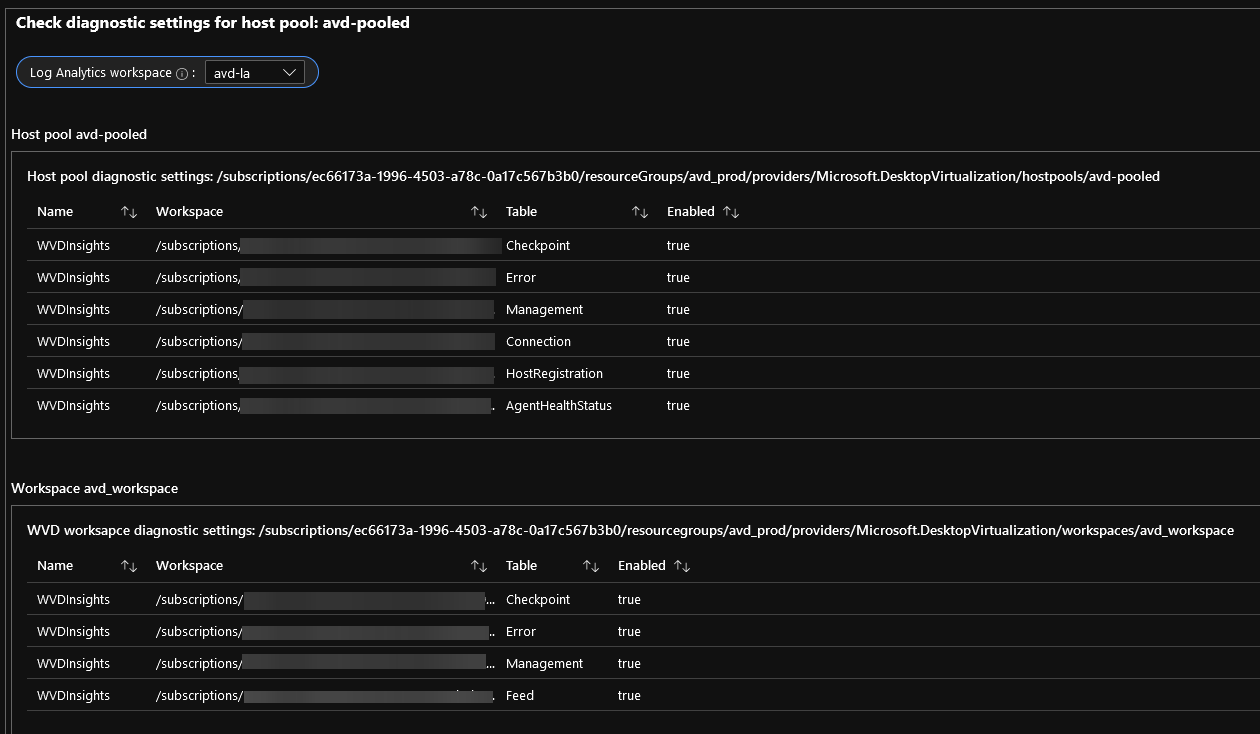
Once the Workspace and Host Pool deployments are done, click on Refresh.
-

-
Confirm that Enabled is: True
-
-
The journey is not over yet; now that the Host Pool and Workspace have been configured, we need to add the Session Hosts and configure the performance counters to the same workspace!
-
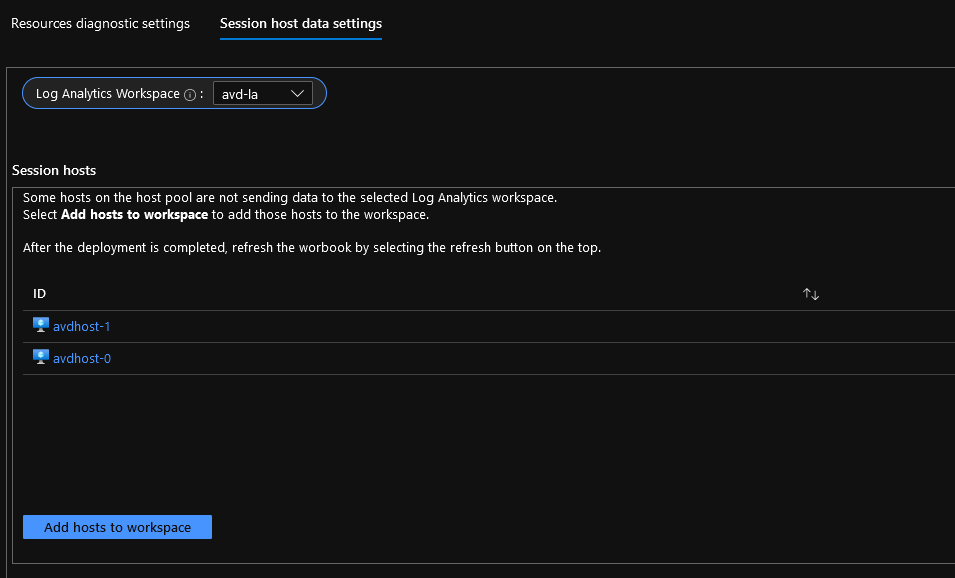
Click on: Session host data settings.
-
Select your Log Analytics workspace
-
Select Add hosts to workspace
-
-
Confirm the Deployment and click Deploy
-
Wait until the deployment has succeeded, or you may get API errors, then select:
-
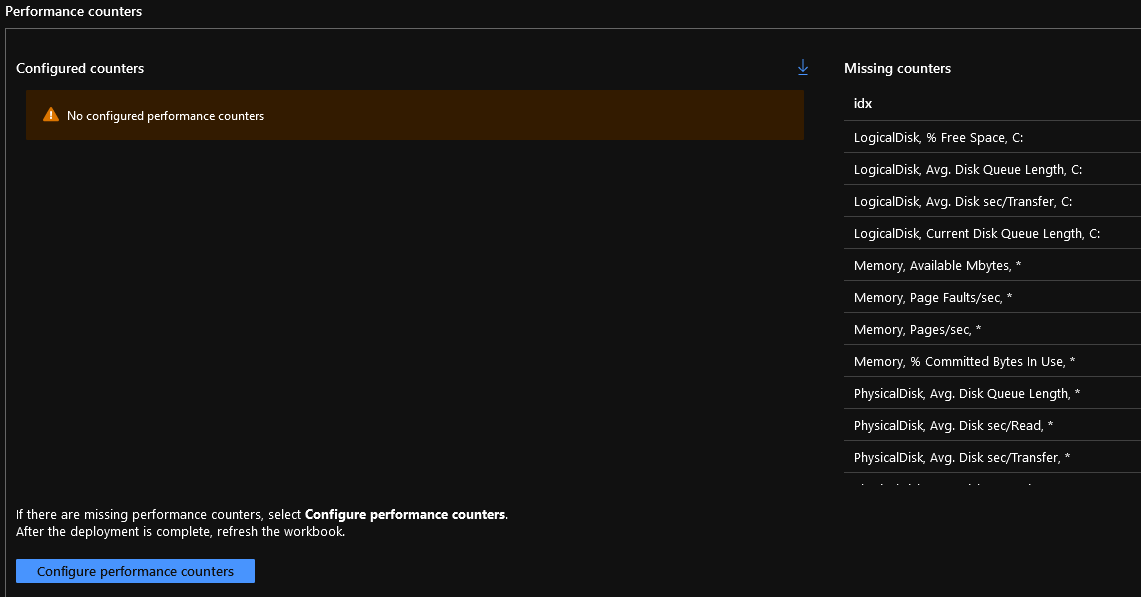
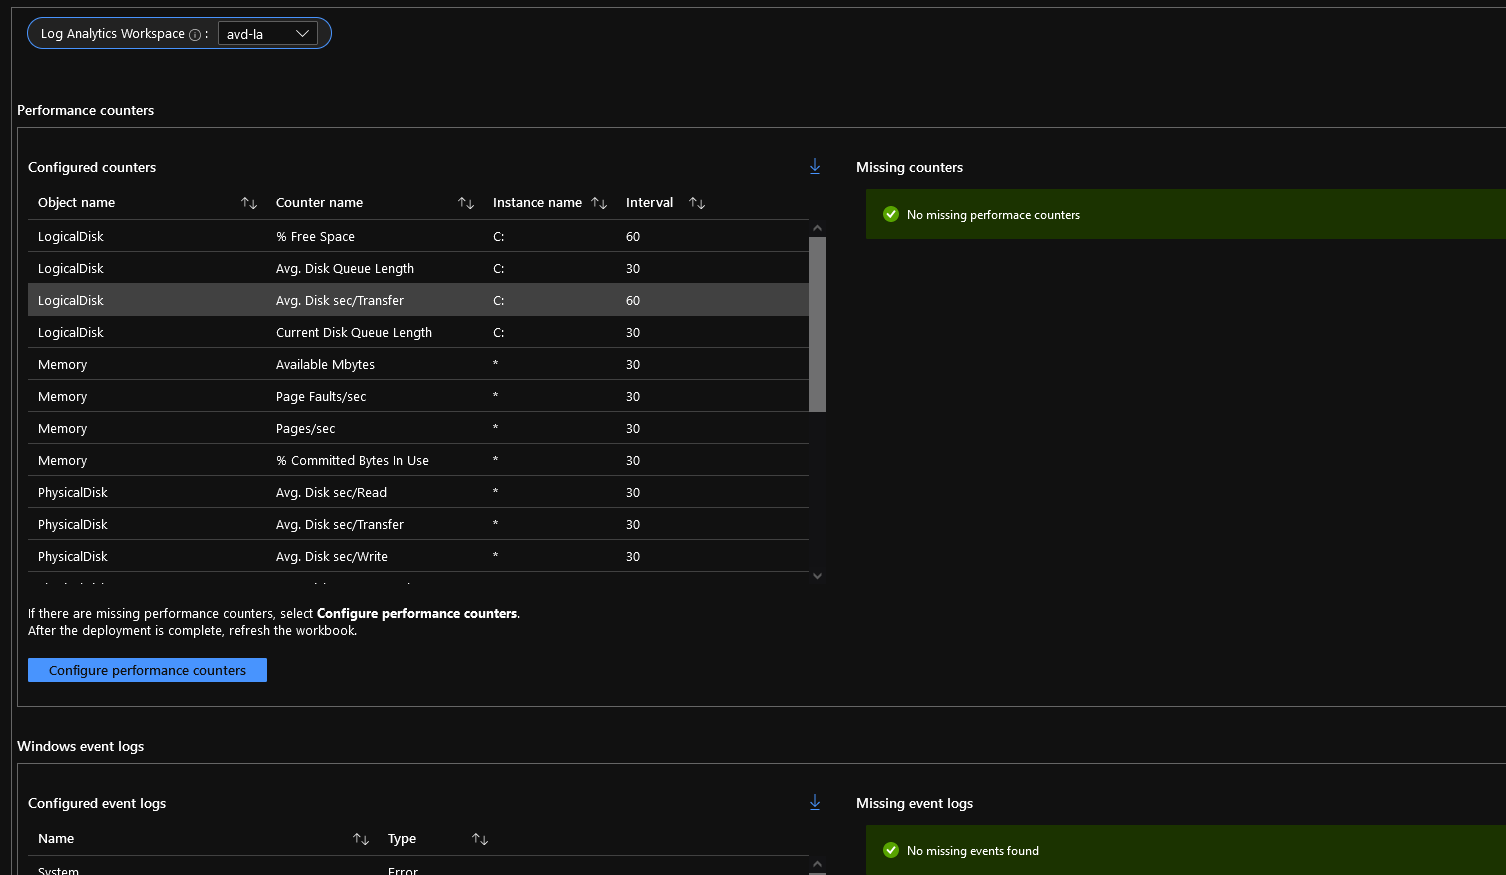
Navigate down and click Configure performance counters
-
-
Click on Apply config.
-
Wait until the deployment has succeeded, or you may get API errors, then select:
-
Navigate down and click on Configure events
-
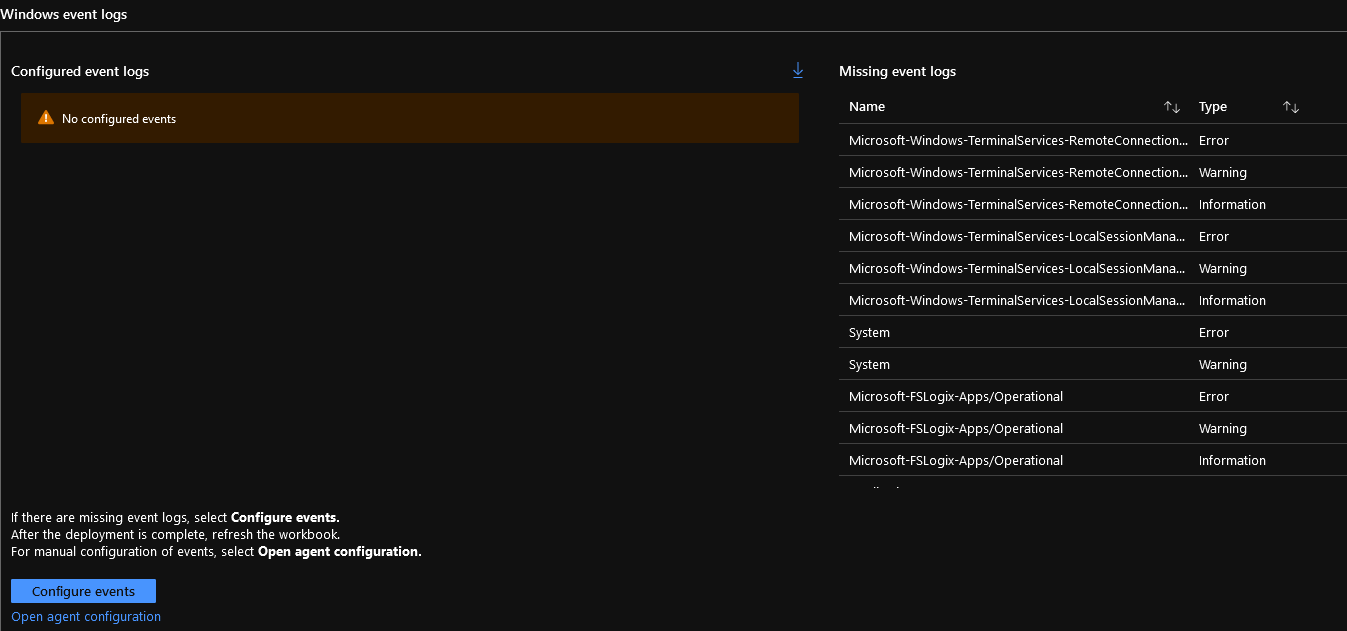
-
Click on Deploy
Now click on: Refresh, and you should see 'No missing performance counters', 'No missing events found'.
-
-
You have now configured Azure Virtual Desktop Insights!
It may take a few minutes to an hour to populate and collect the data for some of the events and counters.
-
On the plus side, all the data is also in Log Analytics so that it can be queried, and you can set up Alert rules against it and get more visibility into your Azure Virtual Desktop environment and use.